 Brainerce Help
Revenue reports
Track revenue, profit, and key metrics over any period from your Dashboard.
Your store's analytics live on the Dashboard. Open it from the top of the sidebar. It shows your headline numbers, revenue over time, and more, all for the period you choose.
Choose a period
At the top of the Dashboard, pick a period:
- Today
- Last 7 days
- Last 30 days
- Custom. Pick any start and end date (up to two years).
Every number on the page updates to match.
These are rolling windows, not calendar periods. "Last 7 days" means the last 168 hours counted back from right now, not last week Monday to Sunday. "Last 30 days" is the last 30 days, not this calendar month. So a figure you read this morning and the same figure this evening cover slightly different windows, and the number can move without a new order.
The timezone you set under Settings → General is not applied here. Day boundaries on the Dashboard are Brainerce's own reporting time, so an order placed late at night in your local time can land in the next day's "Today". Use the Orders list, which shows each order's own timestamp, when you need to reconcile a specific day exactly.
Your key metrics
The cards across the top show:
| Metric | What it means |
|---|---|
| Revenue | Order totals for the period. See What counts as revenue below. |
| Profit | Revenue minus product cost (needs cost prices set). |
| Orders | Number of orders placed. |
| Avg. Order Value | Average amount per order. |
| Conversion Rate | Share of started checkouts that were paid for, not visits. |
Each card shows the change versus the previous period, so you can see at a glance whether you're trending up or down.
Conversion Rate is a checkout-completion rate. It counts the checkouts that started in this period, then asks how many of them were paid. It has nothing to do with how many people visited your storefront: shoppers who browsed and left without reaching checkout are not in the denominator. That makes this number much higher than the "2% to 3% conversion rate" figures quoted around e-commerce, which are visits-to-orders. Do not benchmark one against the other: a healthy Brainerce Conversion Rate is tens of percent, and a drop here means people are abandoning at payment, not that traffic got worse. Traffic-side numbers live on the Traffic tab of the Dashboard.
What counts as revenue
The Revenue card sums the order total of every order in the window, and "order total" means the amount the customer was charged:
- Tax and shipping are included. Revenue is not a net-of-tax figure. If you need sales excluding VAT, take it from your accounting, not from this card.
- Discounts are already deducted. The total is what the customer actually paid after coupons and automatic discount rules.
- Unpaid orders count too. The only orders excluded are cancelled, refunded and voided ones, plus test orders. An order that is still awaiting a bank transfer or is marked cash-on-delivery is already in Revenue before any money arrives.
- A full refund removes the whole order from Revenue. A partial refund removes nothing: the order stays in at its original total, so Revenue does not fall by the amount you sent back.
- Test orders never count, on any period.
Two consequences worth planning around: Revenue is not the same as money received, and it is not the same as your VAT-exclusive turnover. Treat it as a trading figure, and use your payment provider's own reporting for settlement.
Very large stores: each Dashboard figure is calculated from at most 10,000 orders in the selected window. If you take more than 10,000 orders in a period, choose a shorter period. Otherwise the totals will read low with no warning on the page.
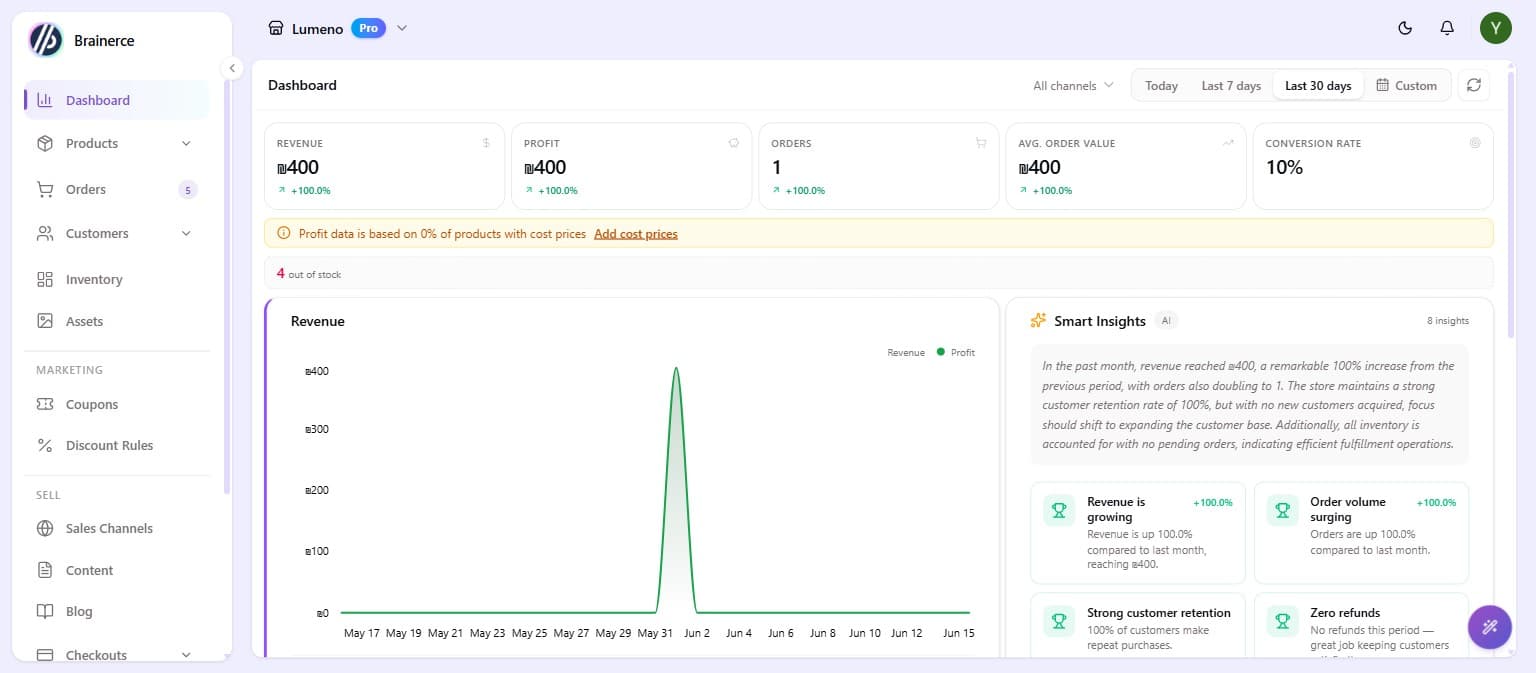
Revenue over time
The Revenue Over Time chart plots your revenue across the period, with profit overlaid. If you sell in more than one currency, switch between Per currency and a single combined total in a reporting currency of your choice.
Profit relies on cost prices on your products. If some products don't have a cost set, the Profit card shows a coverage note. Add costs to your products for accurate profit.
More on the Dashboard
The Dashboard also surfaces orders by status, refund rate, abandoned checkouts, recent orders, and Smart Insights, which are automatic callouts about anomalies and opportunities.
What's next?
Questions about your numbers? Email [email protected].