 Brainerce Help
Analytics
Revenue trends, best-selling products, conversion, promotion performance, and storefront traffic. These are the numbers that run your store.
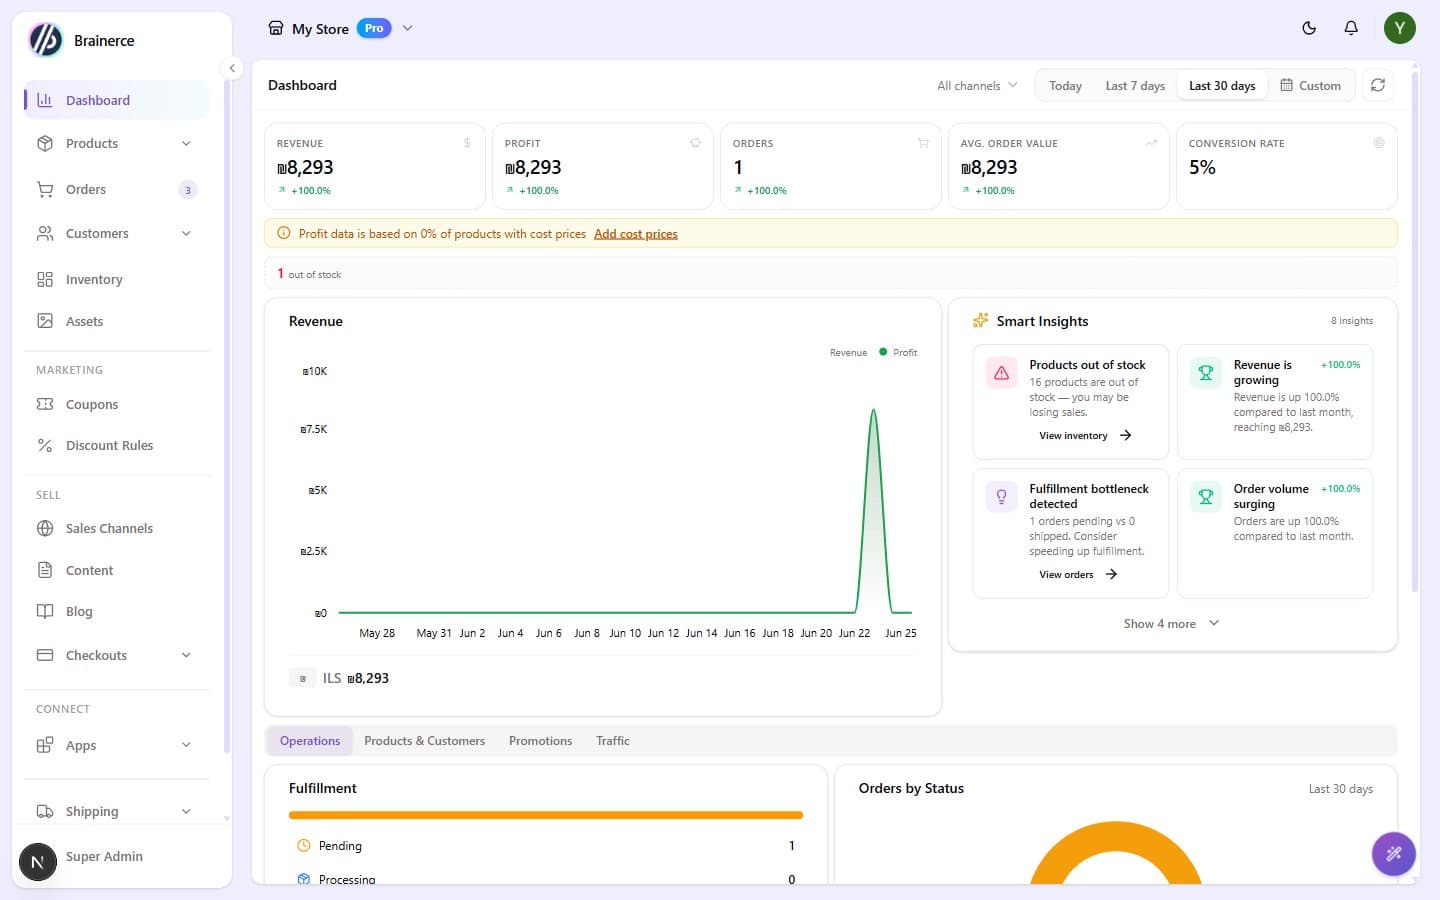
Your analytics live on the Dashboard (the first item in the sidebar), a real-time and historical view of your store's performance, scoped to the store you're viewing. Below the key metrics, the data is organized into tabs.
What you'll find
| Area / tab | What it shows |
|---|---|
| Key metrics (top) | Revenue, profit, orders, average order value, conversion rate |
| Operations | Orders by status, refund rate, abandoned checkouts, recent orders |
| Products & Customers | Best-selling products by revenue; new vs. returning, repeat-purchase rate |
| Promotions | Coupon and discount-rule performance: redemptions and revenue |
| Traffic | Cookieless storefront analytics: visits over time, funnel, by-country, top pages and products |
Date ranges and channel
- Pick a period at the top of the Dashboard: Today, Last 7 days, Last 30 days, or a custom range. Every number compares to the previous period, shown as a percentage change.
- Use the channel selector at the top to scope all the numbers to a single sales channel, or leave it on all channels combined.
Google Analytics, Meta and TikTok
The Traffic tab is Brainerce's own cookieless reporting. It needs no Google or Meta account and no cookie-consent banner.
Separately, your storefront can report to your Google Analytics 4 and Google Ads. Connect the Google app and the tracking starts by itself, with no ID to paste.
The Meta pixel and the TikTok pixel are not available today. Neither app has been released to the app store, and their pixel settings live inside those apps, so there is no box you can reach in the dashboard for either ID. Until they ship, fire those pixels through your own Google Tag Manager container instead. See Google Analytics, Google Tag Manager and the Meta pixel.